

The chart above breaks down Canada’s 1990 and 2005 emissions by province. It shows emissions of all greenhouse gasses, measured in megatonnes of CO2 equivalent. It is interesting both in terms of totals and in terms of rates of change. The only jurisdiction where emissions declined was the Yukon, where they fell from 0.6 to 0.4 Mt CO2e. One obvious fact demonstrated by this chart is that it is possible to address Canadian emissions to a significant extent by focusing on just two provinces, with another three making more modest but still substantial contributions.
This chart shows the population distribution between the provinces in 2005:
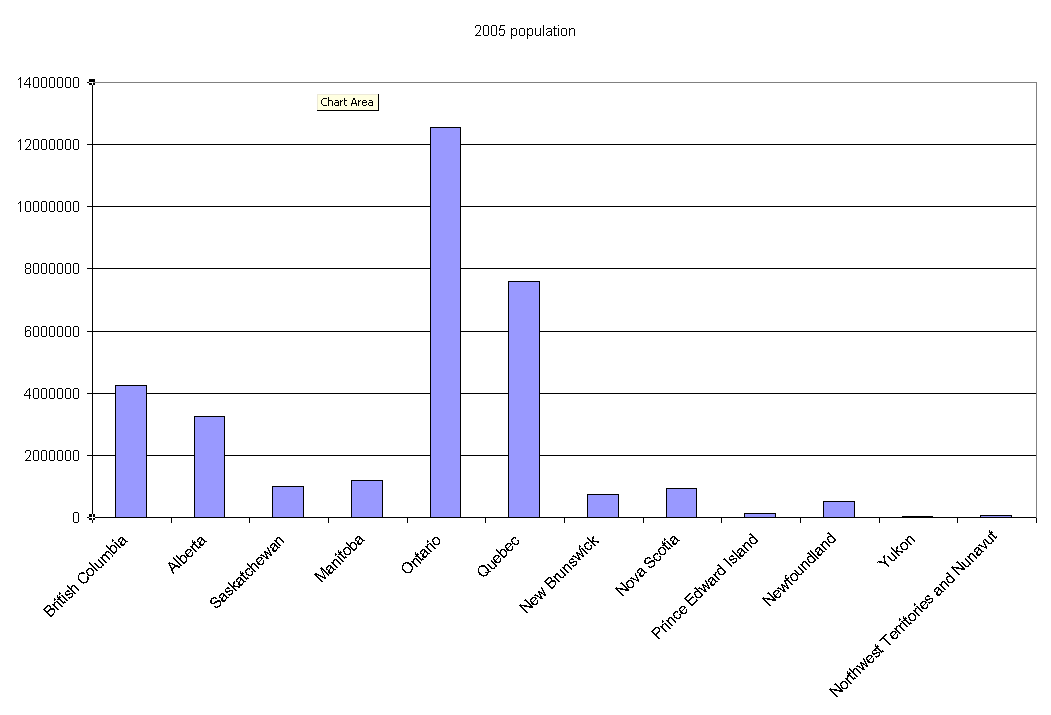
Of course, it is unfair to directly compare emissions with population. When a driver in Ontario drives using gasoline extracted from the oil sands, Ontario bears some responsibility for those emissions. This is akin to the relationship between emissions and world trade, as discussed before. Even so, there is an obvious disjoint between the level of emissions in Alberta and their share of the Canadian population.
To reach a sustainable level of emissions, it will be necessary for everybody to cut their emissions significantly. That being said, the disaggregation of data can help us to make better choices about where to prioritize. From that perspective, the provincial policies of Ontario and Alberta start to look very important indeed.
“When a driver in Ontario drives using gasoline extracted from the oil sands, Ontario bears some responsibility for those emissions.”
Here’s an alternative to thinking emissions responsibility as shared:
The fact that the oil sands oil production exists is entirely the responsibility of Alberta. Ontario has no jurisdiction over the manner of its extraction. The only sensible way to understand emissions responsibility is to make one entirely responsible for the knowable outcomes of your actions. If your actions are to produce a liter of oil, then you bear all the responsibility for the emissions from that oil, including from the consumption of it (at least as far as C02 is concerned, the emissions from one liter are exactly the same no matter how it is used, unless it is burnt very poorly, such that much of the fuel is exhausted unburnt – I think that is rare enough that it can be ignored).
When an ontario driver purchases fuel he has no choice over its method of extraction. So, you can attribute to him responsibility for the C02 produced, plus the industry average CO2 produced in the production and transportation of the fuel.
This system has the disadvantage that everything is counted twice, however, since it is counted precisely twice, you can simply cut each in half (why not?). This would make Alberta fully responsible for its CO2 emissions, but since they would not produce it if there was no one to consume it, you count their emissions as half. Similarly, the consumer is entirely responsible for the use and production of fuel, because without consumers there would be no production.
It doesn’t make sense to draw a line anywhere between the production and the consumption and say “this is where productive responsibility ends and consumer responsibility begins”, rather both are wholly responsible.
When an ontario driver purchases fuel he has no choice over its method of extraction.
True, but he has a choice about whether or not to buy fuel at all. I agree that both parties have some of the moral responsibility, which is why I was saying that both Ontario and Alberta have some responsibility for those emissions.
Fellow-citizens, we cannot escape history. We of this Congress and this administration, will be remembered in spite of ourselves. No personal significance, or insignificance, can spare one or another of us. The fiery trial through which we pass, will light us down, in honor or dishonor, to the latest generation. We say we are for the Union. The world will not forget that we say this. We know how to save the Union. The world knows we do know how to save it. We — even we here — hold the power, and bear the responsibility. In giving freedom to the slave, we assure freedom to the free — honorable alike in what we give, and what we preserve. We shall nobly save, or meanly lose, the last best hope of earth. Other means may succeed; this could not fail. The way is plain, peaceful, generous, just — a way which, if followed, the world will forever applaud, and God must forever bless.
Alberta unveils new climate change policy
Jason Fekete, Calgary Herald
Published: Thursday, January 24, 2008
The Stelmach government released a new climate change policy Thursday morning that aims to cut greenhouse gas emissions by 14 per cent of 2005 levels by 2050 – a far weaker policy than what Ottawa has proposed.
Alberta’s updated policy focuses largely on carbon capture and storage and has long-term goals of cutting emissions 200 megatonnes by 2050 – equal to a 14-per-cent reduction from 2005 levels. About 70 per cent of those reductions are expected to be achieved through carbon sequestration.
Facts about climate change from the government of Alberta
Alberta’s 2008 climate change strategy
Provincial GHG reduction targets:
Ontario: 15% below 1990 levels by 2020
Quebec: 6% below 1990 levels by 2012
B.C: 10% below 1990 levels by 2020
New Brunswick: 10% below 1990 levels by 2020
Nova Scotia: 10% below 1990 levels by 2020
Newfoundland: 10% below 1990 levels by 2020
Alberta: 14% below 2006 levels by 2050
“There are a lot of great investments that you can make. If you are investing in tar sands or shale oil then you have a portfolio that is crammed with subprime carbon assets.
And it is based on an old model.
Junkies find veins in their toes when the ones in their arms and their legs collapse.”
–Al Gore
Hello
I am wondering if you would be willing to share the CO2 * Province data used to create the graph above.
Ted Auch
One source is Canada’s 2004 National Inventory Report.
Table 1-2: Total Reported GHG Emissions by Province/Territory is on page 25 of the PDF.
More current information may be available elsewhere.
Greenhouse gas emissions by province/territory, 1990 and 2005
Statistics Canada
Source: Environment Canada, 2007a. National Inventory Report: Greenhouse Gas Sources and Sinks in Canada, 1990-2005. Greenhouse Gas Division, Ottawa, Ontario.
Carbon geography
Posted 1:20 AM on 18 May 2009
by David Roberts
Devilstower references a new (as-yet-unpublished) paper I mentioned the other day: “Carbon Geography: The Political Economy of Congressional Support for Legislation Intended to Mitigate Greenhouse Gas Production” [PDF], by UCLA economics professor Matthew Kahn and Michael Cragg of the Brattle Group. I know PDFs are not everyone’s favorite leisure activity, but read this paper. [I’ve put the maps from it at the bottom of this post.]
It’s about per-capita carbon emissions and how they vary among U.S. states, both overall and by economic sector. Unsurprisingly, states with high per-capita emissions roughly map to lawmakers hostile to carbon legislation. Also unsurprisingly, the disparities trace in large part back to coal.