
Among the statistically inclined, there are few more elegant bits of mathematics than the bell curve or ‘normal’ distribution. At the centre, you have the most predictable outcome for any variable: say, the amount of food you eat on the average day. Higher and lower numbers close to the mean are still quite probable, but each possibility gets less and less likely as you move farther out. While you probably vary your food intake by hundreds of grams a day, it is rarer to vary by kilograms and quite rare to vary by tens of kilograms.
The reason the bell curve in particular is so charming is that it gives us the opportunity to assign probabilities to things. For instance, we can take the mean weight of airplane passengers, the standard distribution in the population (a measure of how much variation there is), and come up with a statement like: “99.9% of the time, this plane will be able to seat 400 people and have sufficient power to take off.”
That being said, there are big problems with assuming that things are like bell curves. For one, they might not be ‘unimodal.’ We can imagine a bell curve as being like a mountain of probability, where the peak is the mean and the slopes on either side represent less probable outcomes. Some distribution ‘mountains’ have more than one peak, however. A distribution of the heights of humans, for instance, has a male and female peak. If we took the male peak as the mean and tried to predict heights based on the standard deviation for the whole sample, we would find that there are a lot of unexpectedly short people in the sample (women).
Another big problem is that the peak might not be symmetrical. Consider something like the amount of money earned in an hour by a reckless gambler or stock broker. On one side of his average earnings are all the below-average instances, which are probably many. On the other side, the slope may taper off. On a few extremely lucky hours, they might earn dramatically more than is the norm, and do so in a way not mirrored in the shape of the distribution on the other side. Assuming that the distribution is like a bell curve will make us assign too low a probability to these outcomes.
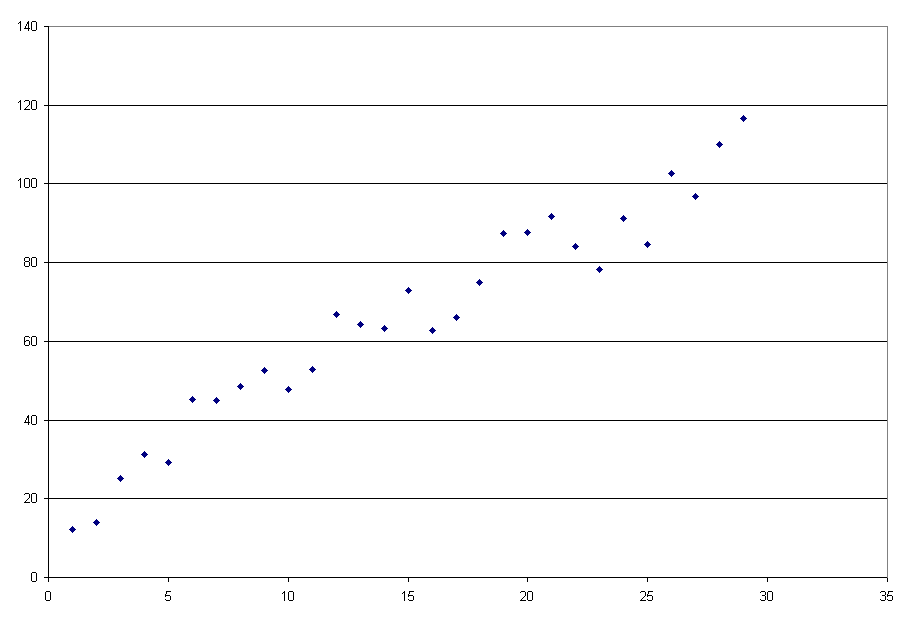
The last problem I am going to talk about now is a venerable one, commonly associated with Bertrand Russell. Imagine you see a trend line that jitters around a bit, but always moves upwards. Asked what is likely to happen next, you would probably suggest a jump comparable to the mean increase between past intervals. Too bad the data series is grams of food being eaten by a turkey per day, and tomorrow is Thanksgiving. You might have a beautiful bell curve showing the mean food consumed by the turkey per day, but it might all fall apart because something that undergirded the distribution changed. Those whose pensions were heavily based on Enron stock have an acute understanding of this.
When their use is justified, bell curves are exceptionally useful. At the same time, using them in inappropriate circumstances is terrifically dangerous. Just because a stockmarket fall of X points is five standard deviations greater than the mean does not imply that it will happen 0.00005733% of the time, despite what bell curve equations and relatively soft-headed statistics instructors might tell you.


